PURPOSE OF THE GRAPHS
We have developed a useful tool called a “spider graph” for demonstrating and evaluating the strengths and weaknesses of a bull's body conformation. Conformation is a critical indicator of how well the animal will function for the producer in terms of meat cutout and other traits. I first saw a graph of this type in France, used to illustrate progeny performance in sheep, and I applied the concept to evaluating cattle. We now use this tool to help farmers make breeding decisions for their grass-fed beef program.
Breeding is the art of making pairs--combining complementary traits. Breeders can use the spider graphs to identify weak traits in individual animals and correspondingly strong points in potential mates, and proceed to create offspring with a more perfected body conformation.
To develop the graphs we take key measurements of the animal’s body, and create ratios that compare the measurement of a certain body part to the measurement of another body part on the same animal. For example: a ratio of the heart girth to the top line. Then we represent those ratios in a visual layout that makes the animal’s potential clear to the breeder at a glance. Note that while the graphs discussed here and shown below apply to bulls, graphs could be made to evaluate cows, but the ratios in the graphs would be different.
For grass-fed beef, we want animals that have the capacity to take in and digest large amounts of biomass, and body confirmation can indicate this capacity. Structural correctness also correlates to durability and longevity; animals that are long-lived and will breed consistently for many years are critical for financial success. In addition, the ratios utilized in the graphs allow us to predict volumes of meat; bulls with a heart girth that is bigger than the top line will have a higher volume of meat in the high-value areas of the animal - the loin and rib areas - and will pass these characteristics on to their progeny.
DEVELOPMENT OF THE LINEAR MEASUREMENT SYSTEM
The basic linear measurement approach has been used for centuries to evaluate cattle. In utilizing and refining it, I have drawn on work done over a period of years by Jan Bonsma, Burl Winchester, Karney Redman, and Gearld Fry. Bonsma understood the significance of measurement and wrote about it in Man Must Measure, Livestock Production, 1983, but the task of distilling Bonsma’s ideas into a system fell to Winchester and Redman, who wrote a pamphlet titled Why Measure? in 1988. In recent years Gearld Fry has popularized this approach, and it was Gearld who introduced me to the importance of linear measurement. Since then I have confirmed the basic validity and significance of this system, and have gone on to refine it through my field work throughout North American, and in New Zealand, Argentina, Uruguay, England, and France, and also through marketing meat to stores and restaurants throughout the Northeast. This extensive experience in applying the concept led me to create spider graphs as a way for others to put linear measurements to good use.
HOW EACH SPIDER GRAPH IS CREATED AND USED
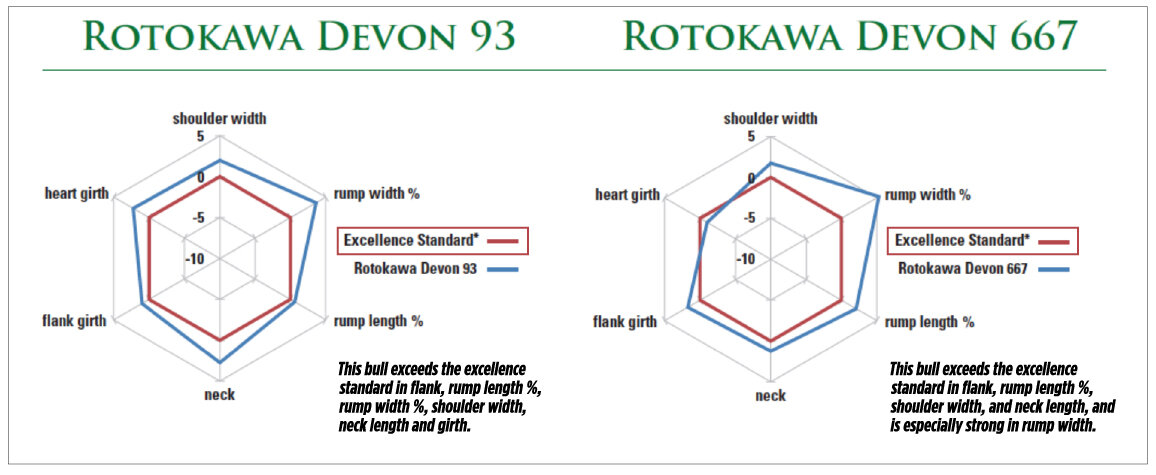
The measurements used for the ratios in Spider Graphs for bulls are rump length, 2/3 body length, total top line, heart girth, flank girth, shoulder width, rump width and hip height. From these eight measurements we determine five key ratios that reveal balance and structural correctness for an animal to flourish on a 100% grass and forage diet.
What follows is a description of how the graphs are plotted, and how the breeder can use them. The graphs will indicate the general potential of a particular bull to thrive in an 100% grass-fed program, and identify areas of weakness or strength. Note that the value of “0” depends on which measurement we’re considering.
“Girth” indicates the heart girth compared to top line. The heart girth should be at least equal to the top line, and every inch of heart girth that is greater than the top line adds 37 pounds of red meat to the high-value areas of the animal. Adding heart girth to your meat animals is the easiest way to increase the value of the carcass and earn more money per animal in your herd. The “0” on the spider graph is set at equal; “0” indicates that the heart girth equals the top line.
“Shoulder width” is the comparison of the rump length (not the rump width) to the shoulder width. The rump length is the measurement from the hooks to the pins and, when compared to the shoulder width is indicative of masculinity and the presence of testosterone. The male is all about the shoulders. (The female is all about the rump.) The bull should have shoulders at least 2” wider than the rump length as a young bull, and a mature bull should to have shoulders at least 4” wider than the rump length. The “0” on the spider graph is set at plus-2 inches, the minimum for a good bull.
“Rump width percent” is the comparison of the hip height of the bull to the rump width. A higher percentage is indicative of volume of meat in the rump area. We expect the bull to be 44% as wide as he is tall. Wider is better—the “0” on the spider graph is set at 44%.
“Flank girth” is a comparison of the flank girth to the heart girth. On a bull, we would like to see these numbers be equal. A “0” on the spider graph indicates that the flank girth equals the heart girth. Equal is the ideal, but bulls will be greater or less in this measurement.
Rump length is the comparison of the rump length to the two-thirds body length of the bull. This 2/3 length is measured from the rear of the animals to the point on the backbone directly above the point of the shoulder. The “0” in the spider graph is set at 36%.
Remember, all animals have strong points and weak points. Each spider graph shows an excellent standard compared to ratios of a particular animal that may fall short of the standard or may exceed it. These graphs will help producers make more informed choices on breeding. The bulls used for the examples are Rotokawa® Devon bulls, which are especially “prepotent,” that is, they have the “bull power” to impact their offspring in a consistent way. But within any breed, each bull has unique characteristics. You can see from the spider graphs which ones are stronger in the heart girth, rump width percent, and in the shoulder measurements. While Devons are used as examples, the concept applies to other British breeds as well as Devons, including Hereford, Angus, Red Angus, British White, Galloway, Murray Gray, and other breeds that can flourish on grass.
In summary, our Spider Graphs provide specific criteria for breeding decisions that can be documented and communicated to others.
EXAMPLES OF SPIDER GRAPHS FOR EVALUATING LINEAR MEASUREMENTS
Developed by Ridge Shinn, CEO Big Picture Beef
413.657.7709